This feature is only available for Lightspeed Retail merchants on select pricing packages.
Sales by Department Report
Check out the Sales by Department report to see how each of your departments are doing: which generate the most sales, discounts, returns, and more!
Table of Contents
Run the Report
From BackOffice, run the Sales by Department report for an overview of departmental sales activity.
In BackOffice, click 'Reports' and select 'Departments'.
Click to Enlarge
Click the date icon to choose a preset or custom range, then click 'Retrieve'.
Click to Enlarge
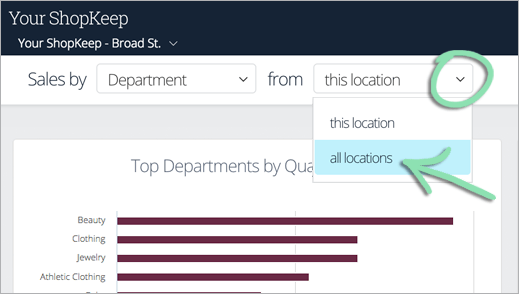
(Optional) Click the drop-down to select whether to run the report for the current location only or for all linked locations.
This setting is available to merchants with multiple linked locations and is only visible to the Business Owner. Visit our New Store Setup article to learn how to create a new linked location or our Multi-Store Management guide to learn how to link existing locations.
Learn to analyze the Sales by Department report to maximize its data to benefit your business. Knowing your best-selling departments can help you pick items to put on sale and decide which types of items to feature.
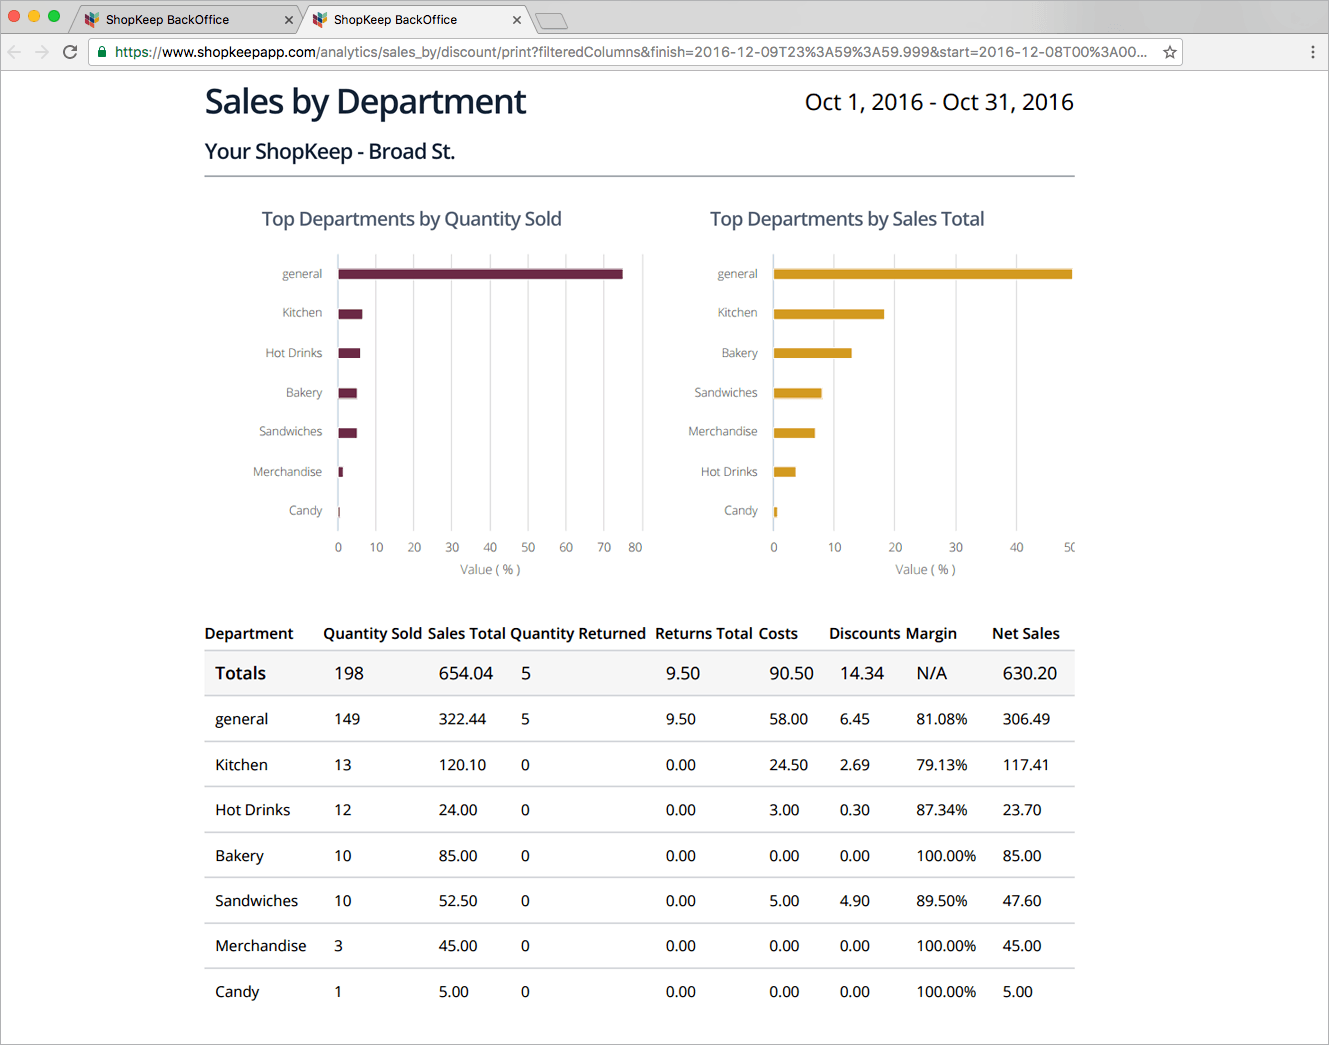
Bar Charts
The charts at the top show the top 10 best performing departments by quantity sold & total sales amount.
Sales are attributed to departments based on the department assigned to each item at the time it was originally sold.
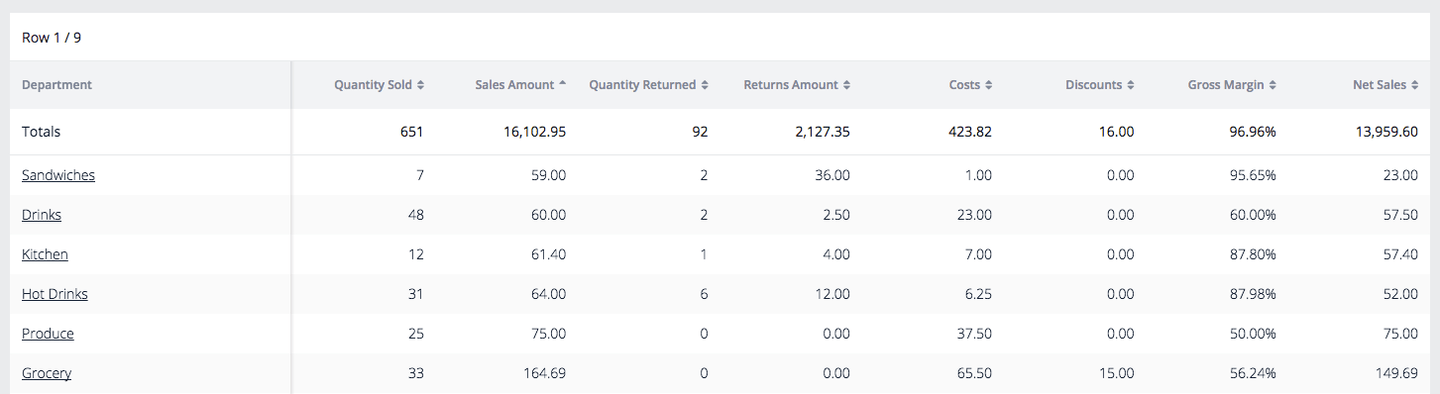
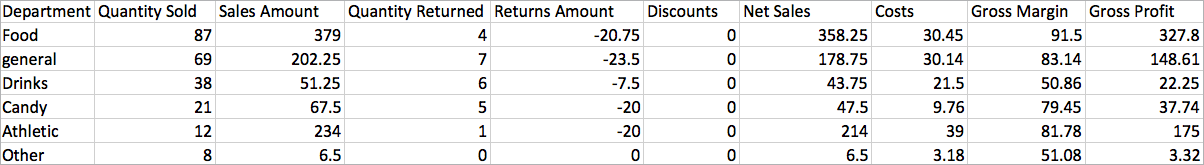
Quantity Sold | The total number of items from that department that were sold.
Sales Amount | Total sales amount before discounts, returns, gratuity, and tax.
Quantity Returned | The total number of items from that department that were returned.
Returns Amount | Total amount refunded before tax, gratuity, and discounts.
Costs | The cost of all sold items minus the cost of the returned items. Cost is calculated using the weighted average cost of an item at the time of sale.
Discounts | The discounts on all sold items minus discounts on returns. Want to see more detail on discount usage? Check out the Sales by Discount report.
Gross Margin | Percentage of revenue left after accounting for cost and discounts.
Net Sales | The Sales Amount, minus the Returns Amount, and minus Discounts.
Click any header with arrows to sort the table ascending. Click again to sort descending.
Click to Enlarge
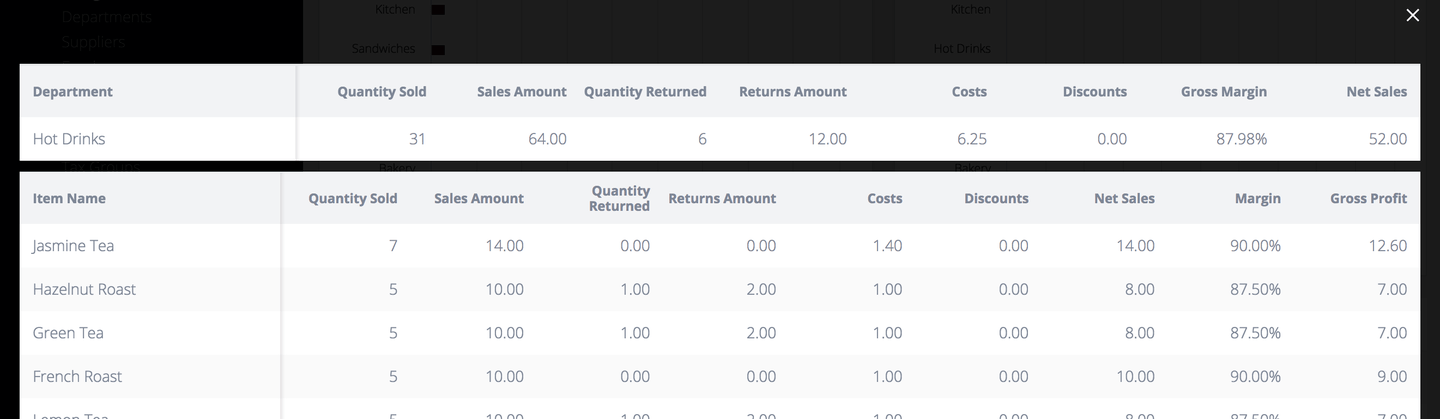
Click any row to view the sold and returned items for that department.
This feature is only available when running the report for a single location. Visit the Run the Report section to learn how to toggle between running the report for a single location or all linked locations.
If you found the Sales by Department report useful, check out the related Sales by Category report next. Visit the Sales by Category article to learn how to access and read this report.
Filter the Report
Filter the report by department to hide departments you don’t want to see or to display only specific departments. Filter by column to customize which table columns appear on the report.
Click 'Filter'.
To hide a department, uncheck its box.
To show the department again, recheck the box.
Use the filter controls to search for a department, select all departments, and clear all selections.