This feature is only available for Lightspeed Retail merchants on select pricing packages.
Sales by Location Report
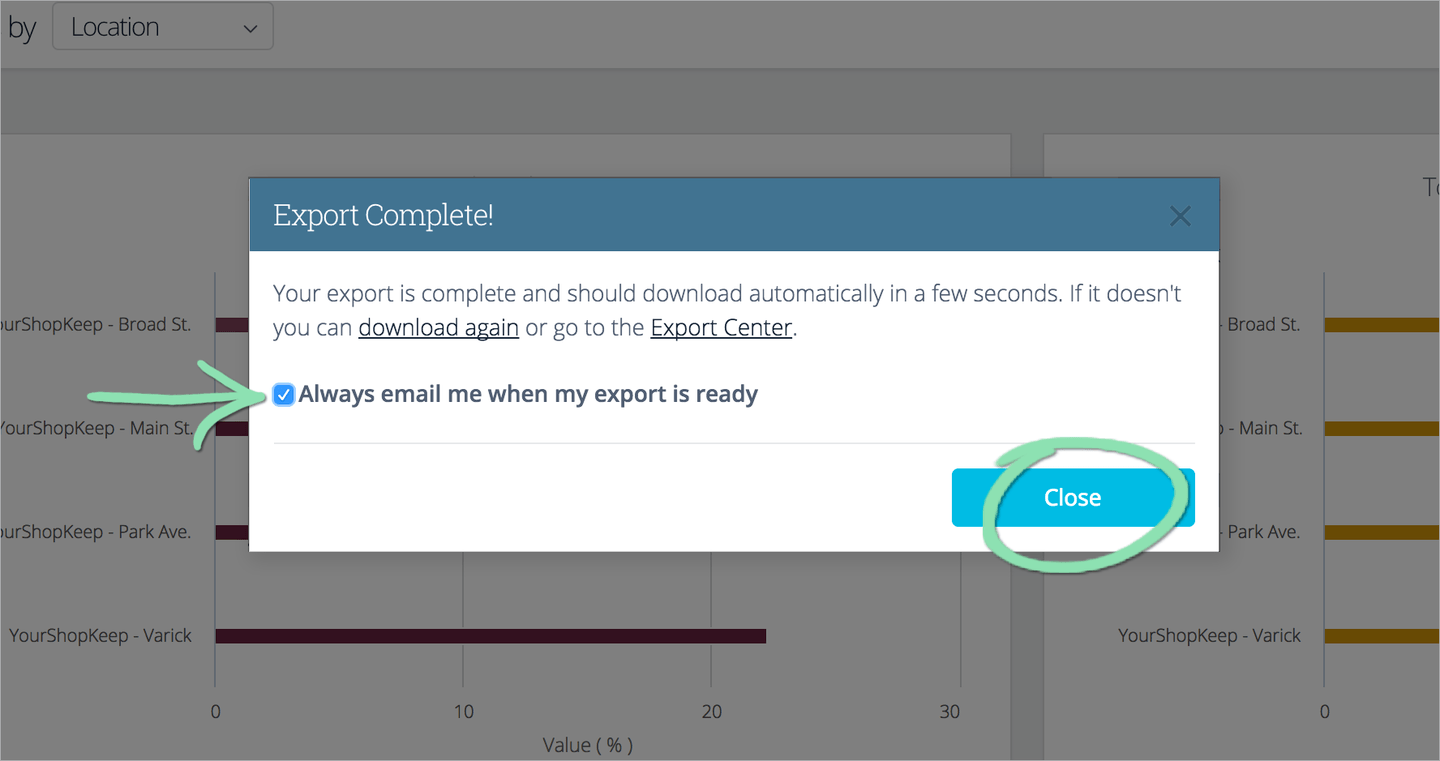
Use the Sales by Location report in BackOffice to compare sales performance across multiple Lightspeed Retail locations. View top stores by sales count or total net sales, and get a breakdown by location of metrics such as gross margin, gross profit, and costs. Filter the report to customize what it displays, then export to a spreadsheet or print the report.
Table of Contents
Run the Report
From BackOffice, run the Sales by Location report for an overview of sales activity across all linked locations during a specific time period.
This report is available to merchants with multiple linked locations and is only visible to the Business Owner. Visit our New Store Setup article to learn how to create a new linked location or our Multi-Store Management guide to learn how to link existing locations.
In BackOffice, click 'Reports' and select 'Locations'.
Click the date icon to choose a preset or custom range, then click 'Retrieve'.
Click to Enlarge
Read the Report
The Sales by Location report lets you view and compare the sales performance of all linked locations. Learn to read this report to better understand how locations match up against one another.
Bar Charts
The charts show top locations by number of sales and by total net sales for the selected date range.
Locations appear with the nicknames currently entered in BackOffice for them. For locations without nicknames, the Lightspeed Retail account name is displayed.
Hover over or tap on a bar to see the sales count/amount and percent of total for that location.
Click to Enlarge
Table View
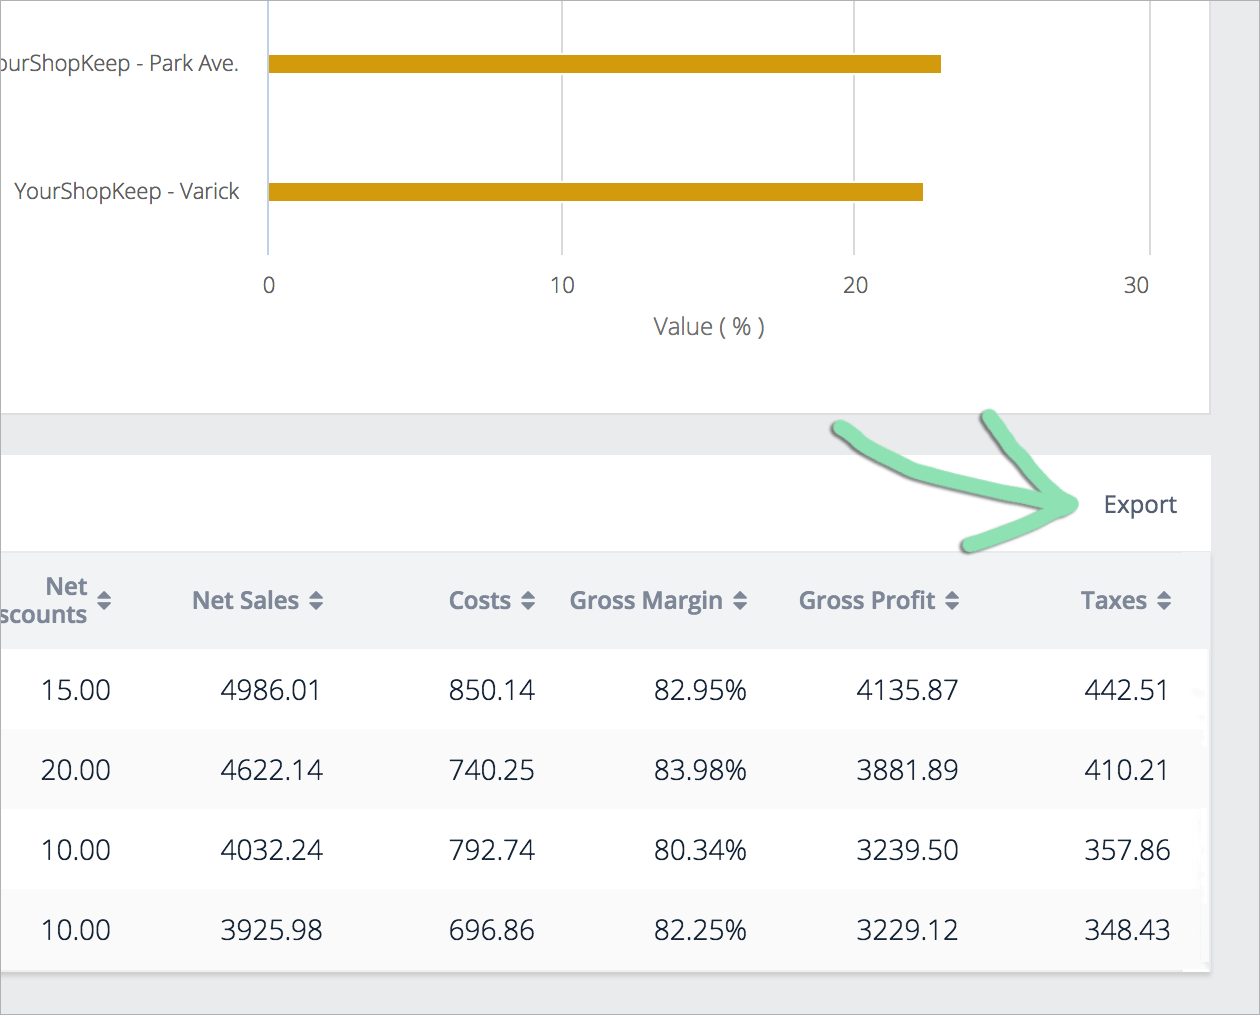
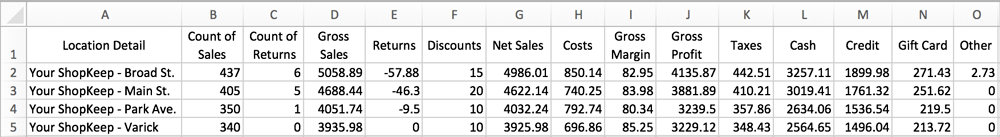
The table view provides detailed information about all locations with sales activity over the selected date range. The first row, Totals, gives the total value for each column.
Location Detail | Nickname of the location as it is currently entered in BackOffice. For locations without a nickname, the Lightspeed Retail account name is displayed.
Count of Sales | Number of sale transactions at the location.
Gross Sales | Total sales amount before discounts, returns, gratuity, and tax.
Net Discounts | Total discount amount applied to sales minus the total amount applied to returns. Want more detail on discount usage? Check out the Sales by Discount report.
Net Sales | Gross Sales minus Returns minus Net Discounts.
Costs | Total business cost of sold items minus the cost of returned items. By default, Cost is calculated using the weighted average cost at the time of sale for each item.
Gross Margin | Percentage of Net Sales left after accounting for costs.
Gross Profit | Net Sales minus Costs.
Taxes | Total tax amount charged on sales minus tax refunded on returns.
IMPORTANT: Sales tax figures in reporting are estimates based on how you have configured your tax rates and tax groups in BackOffice. For official filings, always verify your current local rates, then manually calculate tax using net taxable and non-taxable revenues. Be aware that tax laws can change at any time and you should contact a tax professional for specific tax advice regarding your business.
To learn how tax is calculated in Lightspeed Retail, visit the Sales by Tax Rate Report article.
Cash, Credit, Gift Card, Other | Total net amount received from each payment type, including discounts, returns, gratuity from sales paid for with credit and gift cards, and tax.
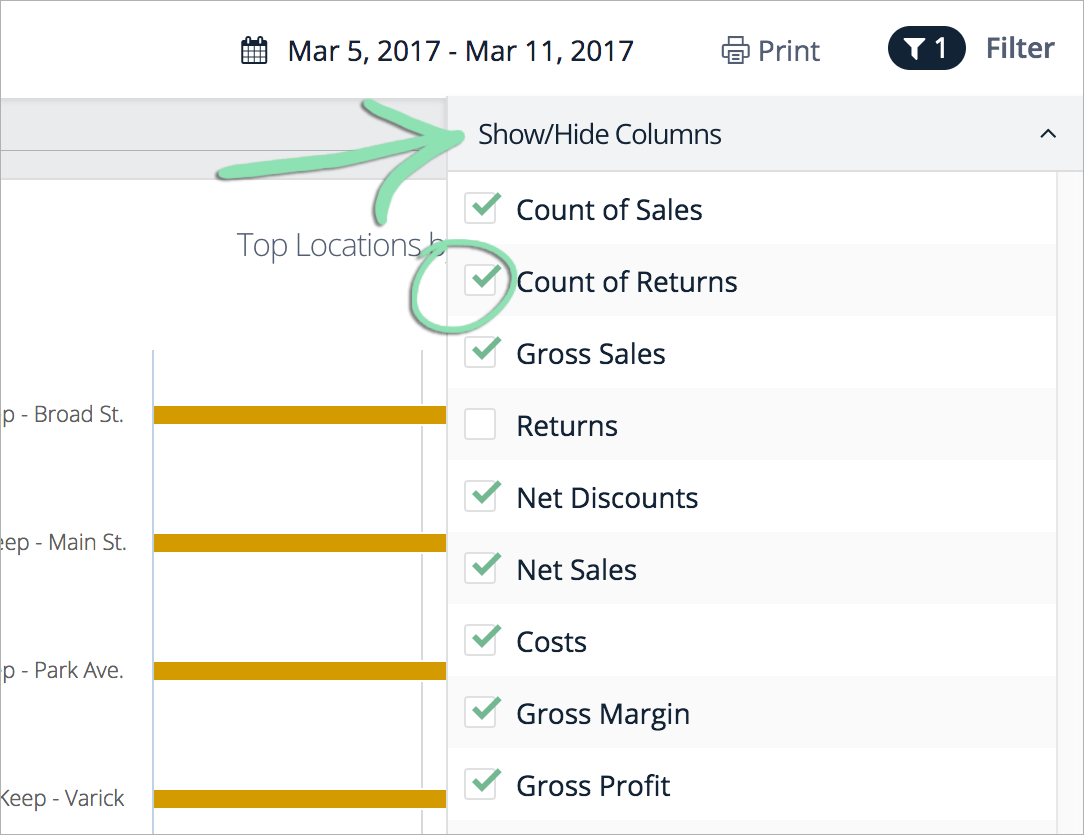
These columns are hidden, but can be enabled by using the filter tool:
Count of Returns | Number of return transactions at the location.
Returns | Total returns amount before tax, gratuity, and discounts.
Check, Coupon, and other tenders | Total net amount received from each payment type, including discounts, returns, and tax.
Click any header with arrows to sort the table.
Click to Enlarge
Filter the Report
Filter the report by location to hide locations you don’t want to see or to display only specific locations. Filter by column to customize which table columns appear on the report.