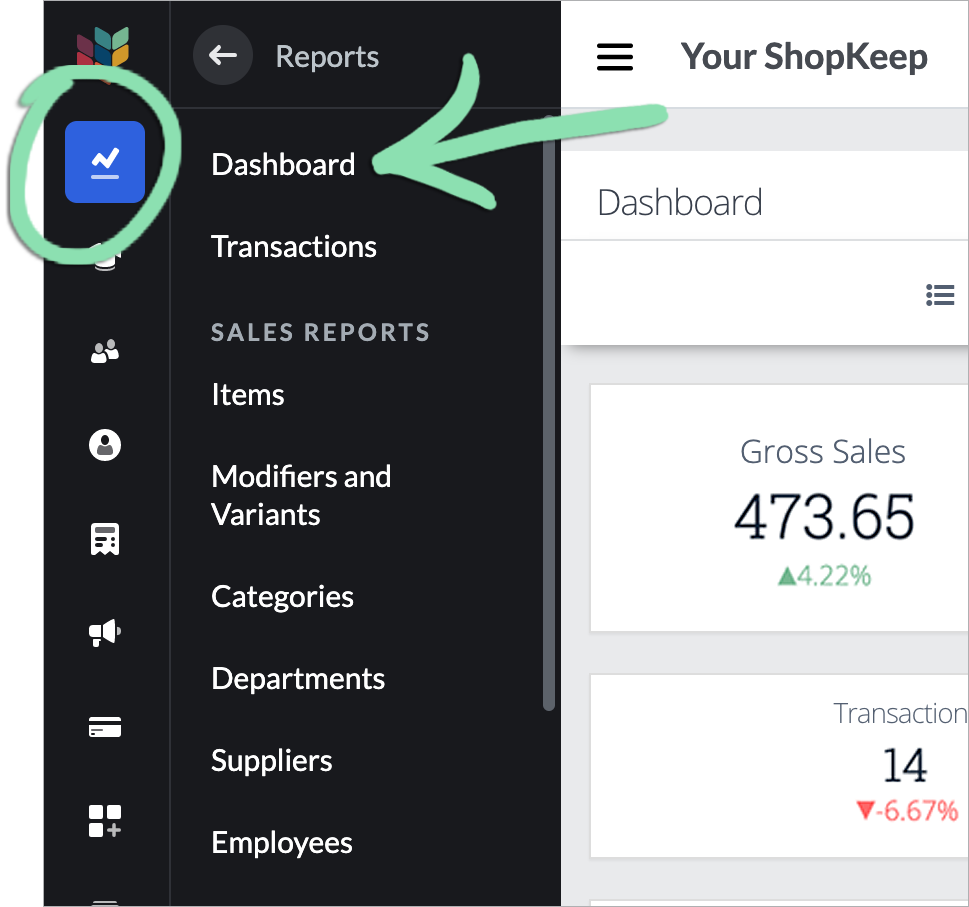
The Dashboard gives an overview of all register activity. View high-level sales and returns totals on the Dashboard Tiles, check out the Sales Graph for a visual breakdown, or open the Summary View for a simplified text-only version of the report. The optional Sales Summary email, sent to the Business Owner, recaps details from the Dashboard for the previous day.
IMPORTANT: Sales tax figures in reporting are estimates based on how you have configured your tax rates and tax groups in BackOffice. For official filings, always verify your current local rates, then manually calculate tax using net taxable and non-taxable revenues. Be aware that tax laws can change at any time and you should contact a tax professional for specific tax advice regarding your business.
To learn how tax is calculated in Lightspeed Retail, visit the Sales by Tax Rate Report article.
Table of Contents
Run the Dashboard
Run the Dashboard by simply logging into BackOffice or manually selecting it from the menu for an overview of register activity over a specific time period.
Click the date icon to choose a preset or custom range.
Click to Enlarge
(Optional) Scroll down and choose a period of time to compare against the selected date range.
Click 'Retrieve'.
Read the Dashboard
The Dashboard summarizes all register activity at your business over a selected date range. Visit the top set of tiles for sales totals, transaction and guest analytics, profitability data, saved sales, and invoices, view the graph for a visual overview of sales, and check out the bottom tiles for top items, sales tenders, customer counts, and register summaries.
Top Dashboard Tiles
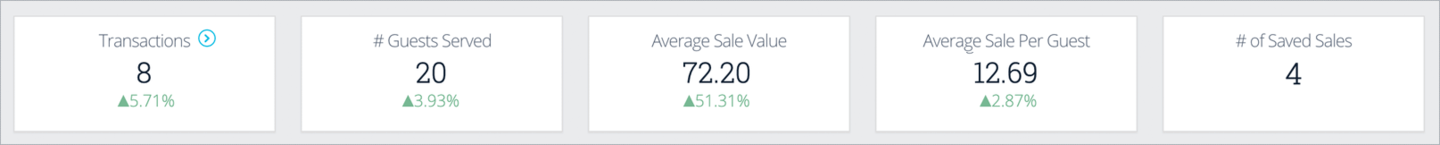
The first set of tiles provides details such as net sales, transaction count, number of guests, and cost of goods sold along with other sales totals, transaction and guest analytics, and profitability data.
Gross Sales | Total sales before discounts, returns, gratuity, and tax. Sales of liabilities are not included here but liability redemptions are. Returns | Amount refunded to customers before tax, gratuity, and discounts. Discounts | Total discounts on all sales minus total discounts on return transactions.
Want a breakdown of which discounts were used? Check the Sales by Discount report.
Net Sales | Gross Sales minus Returns and Discounts. Sales Tax | Total tax collected on sales minus total tax refunded on return transactions.
▲ / ▼ | How the current date range compares with the selected comparison period.
Transactions | Total number of sales and returns performed at the register. Average Sale Value | Average value of a sale before tax (not including liabilities sold). This is Gross Sales minus discounts on sales and divided by the number of sales. Average Items per Sale | Average quantity of items on each sale. Each instance of an item is considered a count (i.e. 5 of a single item counts as 5 items for that sale). # of Saved Sales | Number of saved sales currently open on registers with Saved Sales Sync enabled. Saved sales will only appear in the selected date range if they are open at the register and were last saved during the range. Historical saved sales data is not available. Missing the saved sales tile? If invoices are included in your pricing package, it will be located further down on the Dashboard.
▲ / ▼ | How the current date range compares with the selected comparison period.
Businesses using the Guest Count feature will see tiles for number of guests served and average sale amount per guest, instead of ‘Average Items per Sale’.
# Guests Served | Total number of guests served based on the guest count of each completed sale. Average Sale Per Guest | Average sale amount per guest served. This includes tax but not discounts.
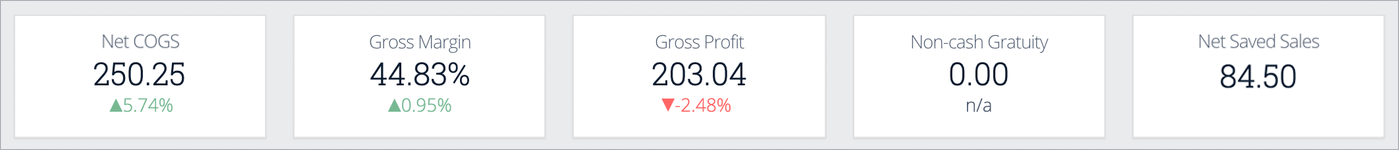
Net COGS | Cost of goods sold. Total cost of all sold items minus the cost of returned items. Gross Margin | Gross Profit expressed as a percentage of Net Sales. Gross Profit | Net Sales minus Net COGS. Non-Cash Gratuity | Tips from sales paid for with credit and gift cards at the register and from Lightspeed eCom (E) orders*, minus refunded gratuity. *Excludes tips left on orders not paid online by credit card (e.g. cash orders) that are placed while Lightspeed eCom (E) online ordering is enabled. To learn more about how tips for online orders appear in reporting, visit our Lightspeed eCom (E) Advanced Topics article. Net Saved Sales | Value of all saved sales included in the ‘# of Saved Sales’ tile. This is the pre-tax subtotal of each saved sale minus discounts applied. Missing the saved sales tile? If invoices are included in your pricing package, it will be located further down on the Dashboard.
▲ / ▼ | How the current date range compares with the selected comparison period.
# of Saved Sales | Number of saved sales currently open on registers with Saved Sales Sync enabled. Saved sales will only appear in the selected date range if they are open at the register and were last saved during the range. Historical data is not available. Net Saved Sales | Value of all saved sales included in the ‘# of Saved Sales’ tile. This is the pre-tax subtotal of each saved sale minus discounts applied. # of Outstanding Invoices | Number of invoices in ‘Open’ and ‘Past Due’ statuses. Invoices will only appear if they were last finished or edited during the selected date range. Historical invoice data is not available. This feature is only available for Lightspeed Retail merchants on select pricing packages. Net Invoices Balance Due | Value of all invoices included in the ‘# of Outstanding Invoices’ tile. This is the pre-tax subtotal of each invoice minus discounts applied. This feature is only available for Lightspeed Retail merchants on select pricing packages.
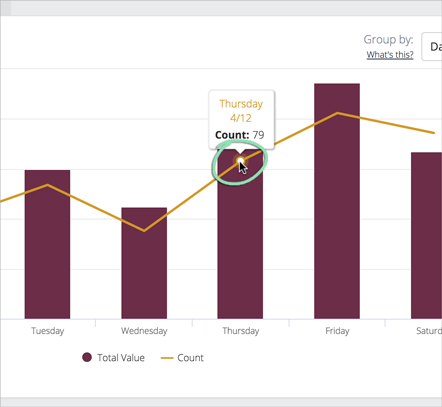
Sales Graph
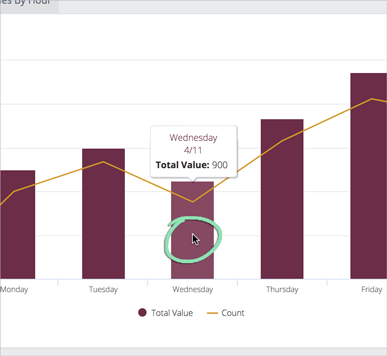
The sales graph tile is a visual summary of sales data with bars representing net sales and a line showing transaction count. The default view displays total sales by hour of the day but can be customized for different time periods.
Select a time period from the drop-down (see definitions below).
Click to Enlarge
Hours | Each position on the graph’s x-axis is a consecutive hour. The graph displays data for each individual hour in the selected date range. Click to view a sample Total Sales by Hour graph
Hours of Day (default view) | Each position on the graph’s x-axis is one of the 24 hours in a day. The graph displays the total per hour of the day combined for all days in the selected range. Click to view a sample Total Sales by Hour of Day graph
Day of Week | Each position on the graph’s x-axis is the same day of the week. The specific day is selected after choosing this time period. The graph displays data for each instance of that day in the range. Click to view a sample Total Sales by Day of Week graph
Weeks | Each position on the graph’s x-axis is 7 days of data. The first day in the selected range determines the start of the first week. The graph displays the total for each week in the range. Click to view a sample Total Sales by Week graph
Months | Each position on the graph’s x-axis is a calendar month of data. The first day in the selected range determines the first month. The graph displays the total for each month in the range. Click to view a sample Total Sales by Month graph
Years | Each position on the graph’s x-axis is a calendar year of data. The first day in the selected range determines the first year. The graph displays the total for each year in the range. Click to view a sample Total Sales by Year graph
Hover over or tap part of the graph to view the net sales amount or transaction count at a point.
Click ‘Average Sales by Hour’ to view average values instead of totals.
This graph only displays sales by hour of the day and is not customizable
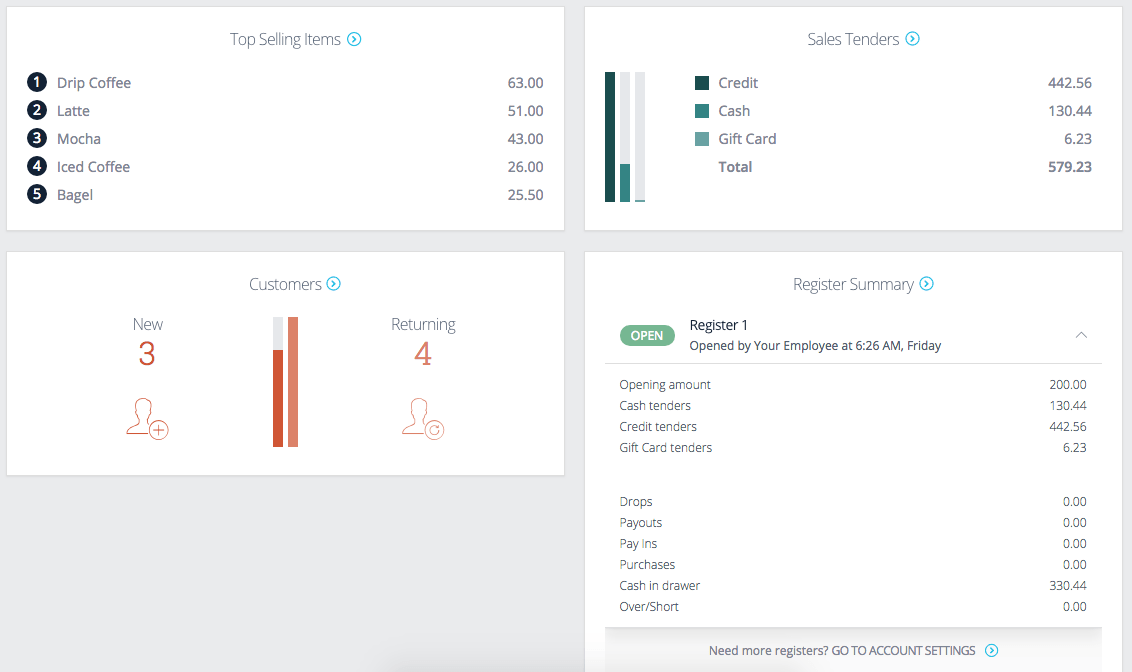
Bottom Dashboard Tiles
The final set of tiles displays the top five best selling items by dollar amount, a breakdown of sales by tender type, and the number of new vs. returning customers.
Top Selling Items | The top 5 items sold by dollar amount. Items appear with the names currently entered in BackOffice for them. Sales Tenders | The total amount received for each tender accepted in your store. Customers | A tally of new and returning customers at your store. Register Summary | Information about the status of all registers for the account. This includes when and who opened or closed the register, opening and closing amounts, the totals of all accepted tenders, any pay ins or payouts performed, and the over or short for the closed register. Employees appear with the names currently entered in BackOffice for them. This tile only covers activity that takes place in the Retail POS (S-Series) app. Sales closed in the Lightspeed Pay app, Lightspeed Pocket app, and via other sales channels are not included.
Wait for the report to open in a new web browser tab.
Click to Enlarge
Sales
Sales | Total sales before discounts, returns, gratuity, and tax. Sales of liabilities are not included here but liability redemptions are. Discount | Total discounts on all sales minus total discounts on return transactions. Want a breakdown of which discounts were used? Run the Sales by Discount report. Returns | Amount refunded to customers before tax, gratuity, and discounts. Net Sales | Sales minus Discounts and Returns. Gratuity | Tips from sales paid for with credit and gift cards at the register and from Lightspeed eCom (E) orders*, minus refunded gratuity. *Excludes tips left on orders not paid online by credit card (e.g. cash orders) that are placed while Lightspeed eCom (E) online ordering is enabled. To learn more about how tips for online orders appear in reporting, visit our Lightspeed eCom (E) Advanced Topics article. Gift Card / Gift Certificate / Deposit | Total sales of each type of liability minus discounts on those liabilities and liability returns. Tax | Total tax collected on sales minus total tax refunded on returns. Total Tendered | Total amount taken in. This is Net Sales plus Tax and new liability sales. Net Cogs | Cost of goods sold. The cost of all sold items minus the cost of items that were returned. Gross Margin | Percentage of Net Sales left after accounting for Net Cogs.
Drops/Payouts/Purchases | Total removed from the cash drawer for drops/payouts/purchases. Pay Ins | Total amount of cash added to the drawer through pay ins. Mda Total | Miscellaneous Drawer Access total. The net effect that drops/pay ins/payouts/purchases have on your cash drawer. This is Pay Ins minus Drops, Payouts, and Purchases.
Sales by Tender Chart
Cash/Credit/AMEX/etc. | Total Tendered broken down by tender type.
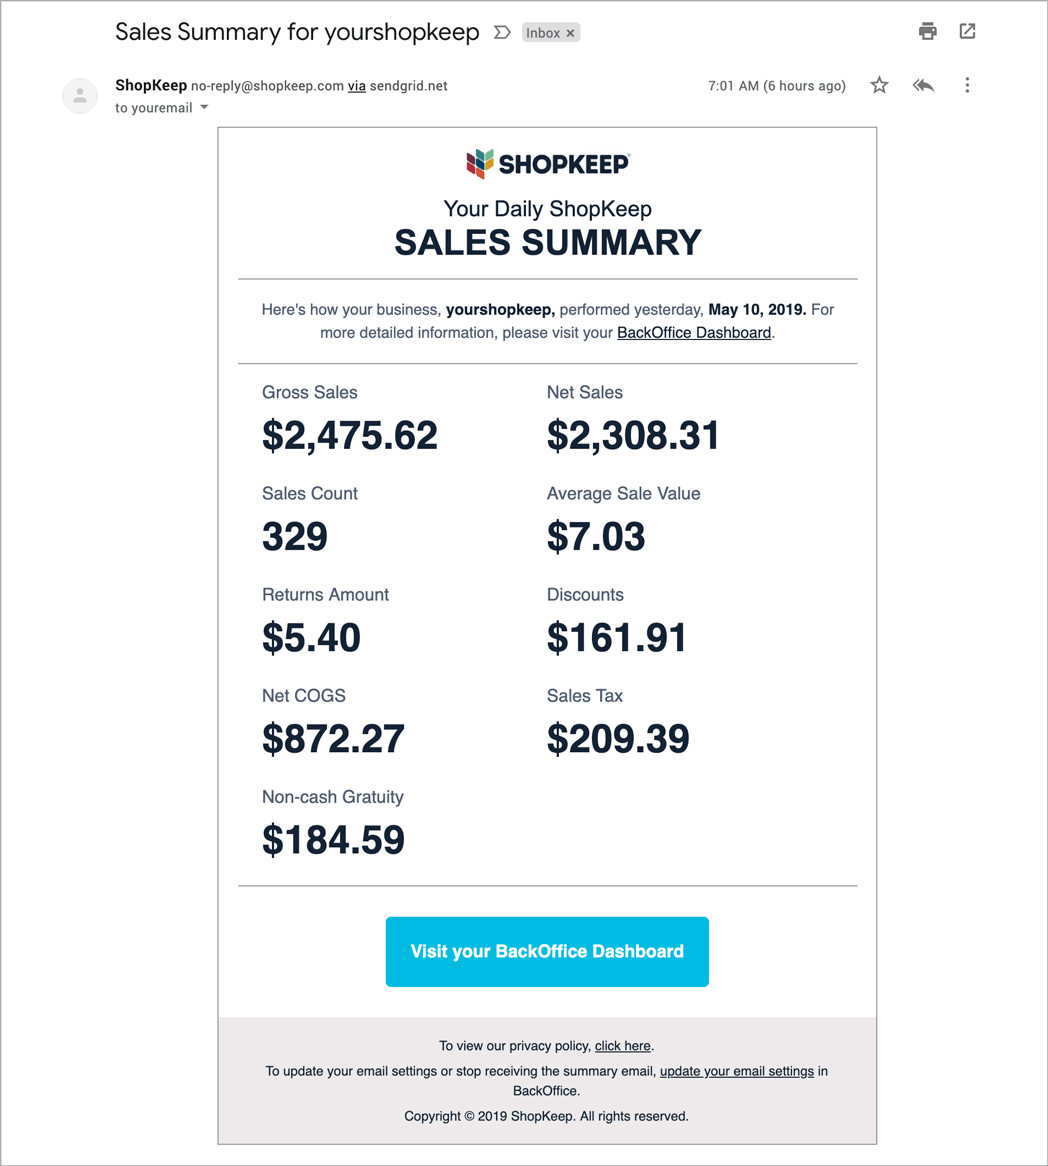
Sales Summary Email
The Sales Summary email gives an overview of sales activity for the previous day (12 AM to 11:59 PM) and is sent to the Business Owner early each morning. Learn below about the data included in the email and how to turn the email off and on.
Gross Sales | Total sales before discounts, returns, gratuity, and tax. Issued liabilities are not included but redeemed liabilities are. Net Sales | Gross Sales minus Returns Amount and Discounts. Sales Count | Total number of sale transactions. Average Sale Value | Gross Sales, minus discounts on sales, divided by Sales Count. Returns Amount | Total amount refunded before discounts, gratuity, and tax. Discounts | Total discounts on all sales minus discounts on returns. Net COGS | Cost of goods sold. Total cost of all sold items minus the cost of returned items. Sales Tax | Total tax charged on sales minus tax refunded on returns. Non-cash Gratuity | Tips from sales paid for with credit and gift cards at the register and from Lightspeed eCom (E) orders*, minus refunded gratuity. *Excludes tips left on orders not paid online by credit card (e.g. cash orders) that are placed while Lightspeed eCom (E) online ordering is enabled. To learn more about how tips for online orders appear in reporting, visit our Lightspeed eCom (E) Advanced Topics article.
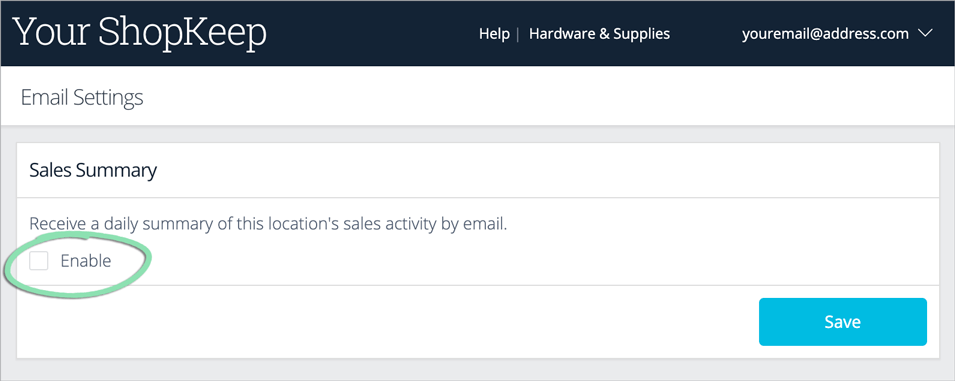
Sales Summary Settings
The daily Sales Summary email is enabled by default and can be toggled off or back on as desired.
Sign into BackOffice as the Business Owner.
Click ‘Settings’, then ‘Email Settings’.
Don’t see ‘Email Settings’? Stay tuned as we roll out this new feature for everyone.